The Basics
This is an overview of the basic elements of the charts that are presented in Trade Therapy content. This section is intended to provide members with a reference or guide to refer to on an ongoing basis. We get a lot of questions about the different components of our charts as many members wish to replicate them.
If you are completely new to analyzing a stock chart, it’s best to start with the individual candles themselves to gain an understanding of what you’re looking at. There are excellent online resources available. Here is an excellent overview provided by Investopedia.
We spend well over 1000 hours per year diagnosing charts. The color scheme in our charts has been selected to limit the effects on our eyes. This is an example of how we’ve adjusted the layout in the event it’s causing any confusion. This is a daily chart for QQQ which can be found in the upper left corner. Just to the right of the name of the asset detailed in the chart (Invesco QQQ Trust Series 1) is the time frame. Notice the 1D indicating this is a daily chart.

Our view of the same chart:
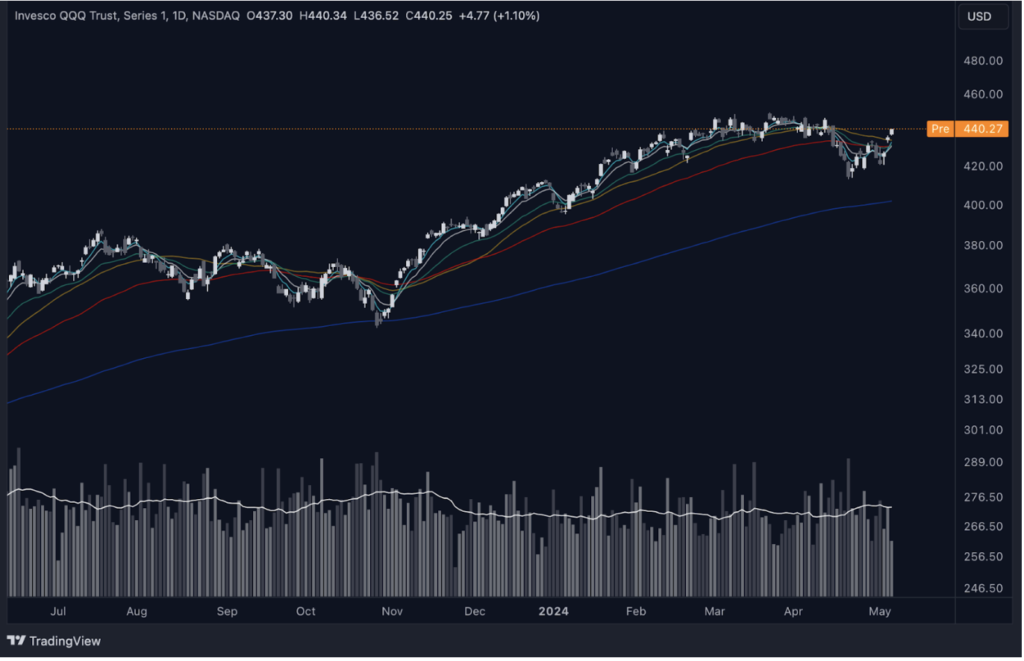
We’ve exchanged green for white/light gray and red for darker gray. It may not be as pretty, but it’s better for our analysts’ vision health.
There are several moving averages that are the colored wavy lines within the chart. Moving averages are measurements of trend direction over a period of time. We use a combination of exponential moving averages (EMA) and simple moving averages (SMA). Simple moving averages simply calculate an average of price data. Exponential moving averages apply more weight to data that is current. This allows EMAs to reflect recent changes in price behavior more accurately which is the main reason we primarily use them.
Moving average legend:
- 5 EMA – light blue
- 9 EMA – white
- 21 EMA – green
- 30 SMA – gold
- 55 EMA – red
- 200 EMA – dark blue
All of our charts are logarithmic (log) including our indicators such as fibonacci extensions and retracements. It is much easier to consider longer term price behavior in log charts as they reflect percentage changes rather than linear changes. We always use log charts on every time frame. If your charts or indicators don’t look like ours, this is the most common reason. Check your settings and adjust them to logarithmic settings.
Volume bars are located at the bottom of the chart. There is a moving average white line indicating the current average volume. Volume is a key data point that will be discussed at length.
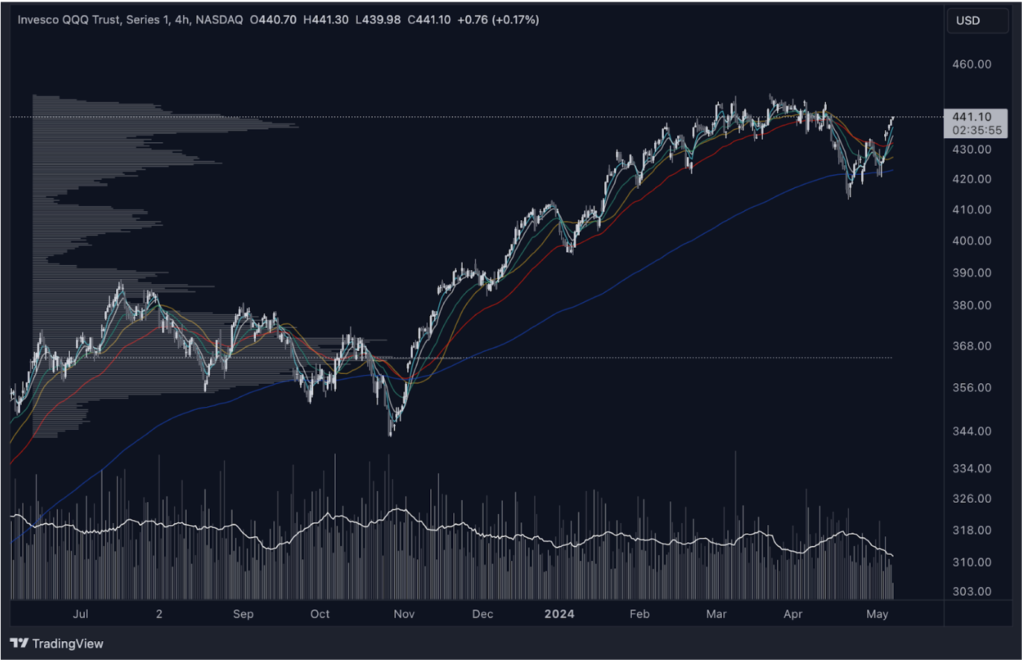
There are several indicators used throughout Trade Therapy charts. The bars extending from the left side (above) represent a Volume Profile. This indicates how many shares were traded at the different price levels. The further the bars extend out to the right, the more shares were traded at those price points. These extended ‘volume shelves’ represent areas of support or resistance as owners at these levels will either defend their positions by buying more or look to exit their positions as the price reaches these levels.
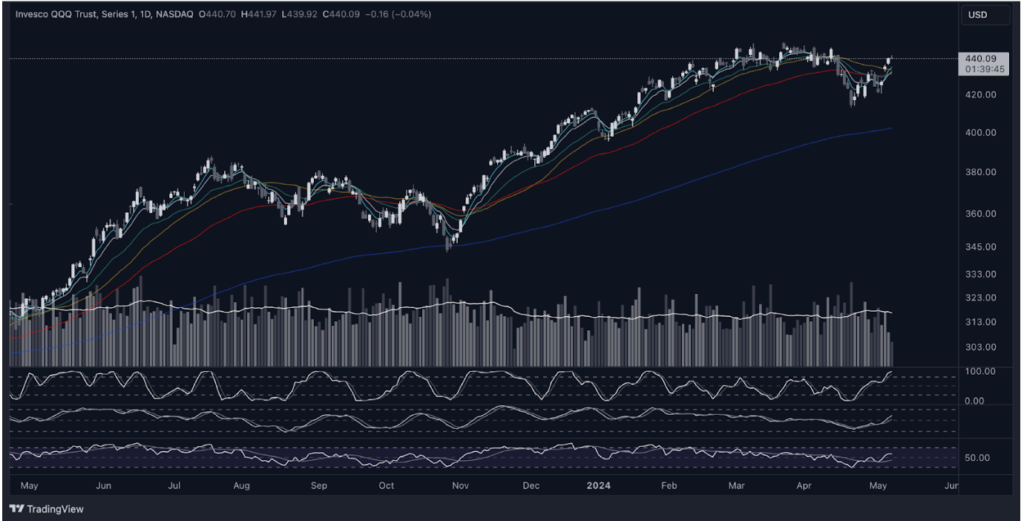
Momentum indicators may be included at the bottom of our charts. These indicators reflect the strength or weakness of the current price behavior. The indicators used from top to bottom are Stochastic RSI, Stochastic and Relative Strength Index. These indicators detail overbought or oversold conditions and can demonstrate divergence. Divergence occurs when price behavior and momentum indicators are not in harmony. This condition indicates potential future price behavior to correct this divergence. When considering divergence, try to remember, ‘bottoms are bullish, tops are bearish’. Meaning, rising candlestick peaks should be accompanied by rising momentum indicator peaks. If they are divergent, these are the ‘tops’ so this would be a bearish signal.
Advanced technical analysis is also represented in some of our charts for our more experienced members. These theories are well represented in our library and reflect the work of some of the legendary traders from the past. We use them to mark certain key points in our charts to help members identify these key data points and the significance they represent.
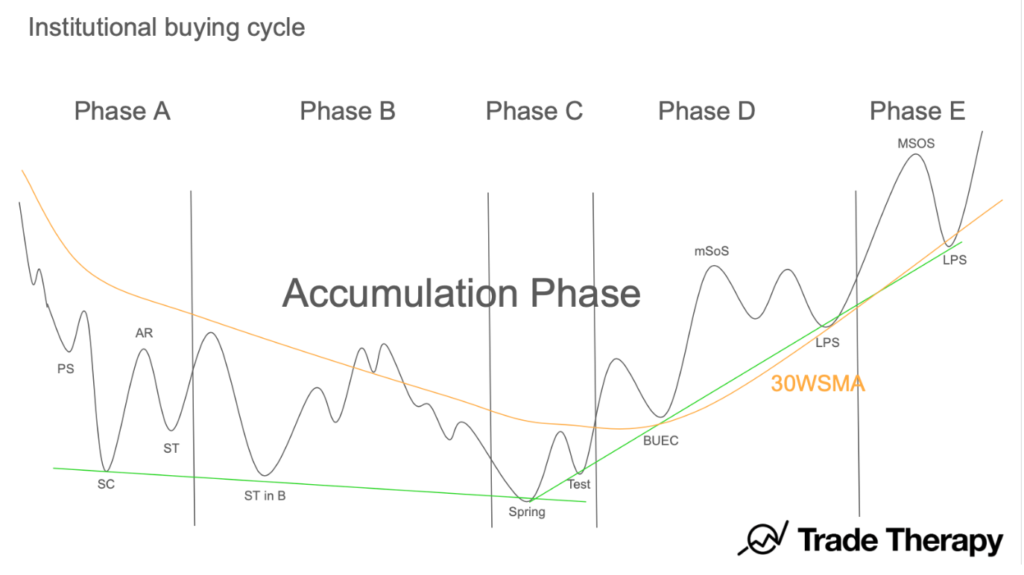
This graphic and the labels at the top/bottom of the structure are Wyckoff labels. This buying cycle represents one of the classic schematics (#1) developed by Richard Wyckoff and commonly referred to as ‘the Wyckoff method’. Additional information and label definitions may be found here.
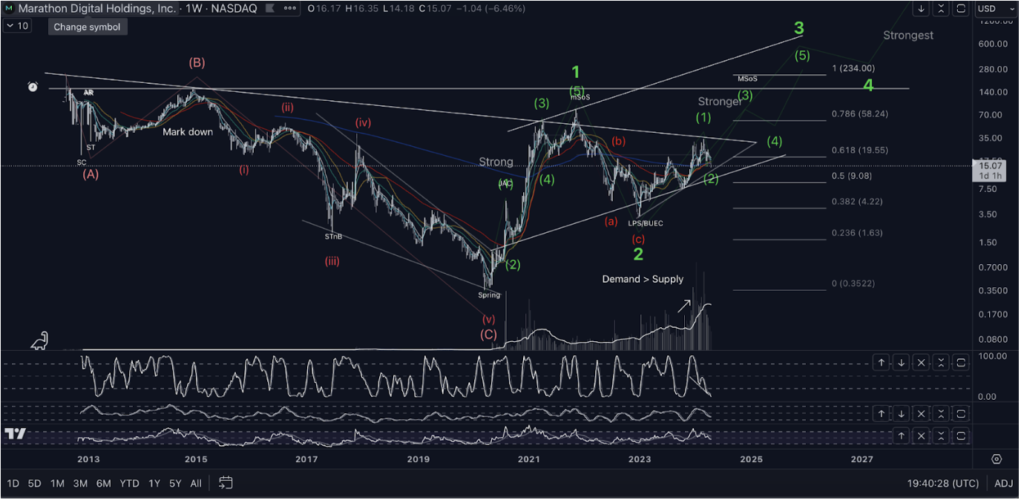
Elliott wave theory (EWT) is also displayed occasionally to reference specific points in the structure of our charts to identify possible expected price behavior. These may be represented as roman numerals or standard numbers depending on whether they are ‘sub-waves’ or ‘primary waves’. EWT is one of the more difficult theories to use correctly and can lead to mistakes (read losses) if used incorrectly. It is VERY common to see charts posted online that are not done correctly. It’s important to understand the basics of the theory (impulsive vs. corrective waves) but not necessary to acquire a deep knowledge of it unless you’re interested in advanced technical analysis.
The combination of Wyckoff, EWT and volume analysis is the highest level of technical analysis. Using them together forms the basis of an effective weight of evidence approach and is the core of Trade Therapy’s analysis.
